NGI The Weekly Gas Market Report | E&P | Markets | NGI All News Access | NGI Data
Decline Continues for Top North American Natural Gas Marketers in 3Q2019 — NGI Survey
Sales of natural gas by leading companies, which had been on the rise from late 2017 until the first three months of 2019, declined for a second consecutive quarter between July and September, according to NGI‘s 3Q2019 Top North American Natural Gas Marketers rankings.
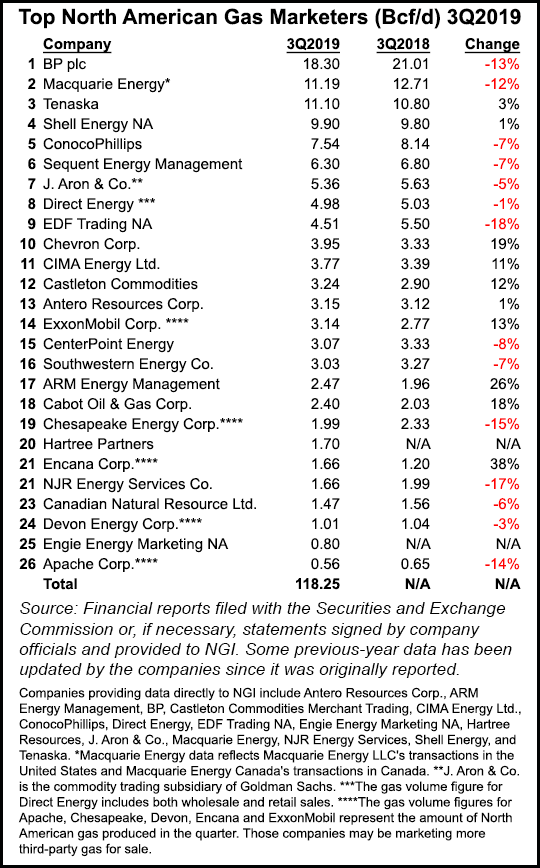
The 26 gas marketers participating in NGI‘s latest survey reported combined sales transactions of 118.25 Bcf/d in 3Q2019.
Prior to decreases reported in the 2Q2019 survey, marketers reported year/year increases in six consecutive surveys, including a 4.29 Bcf/d (4%) increase in gas sales in 1Q2019 compared with 1Q2018, a 5% increase in 4Q2018, a 7% increase in 3Q2018, a 9% increase in 2Q2018, an 8% increase in 1Q2018 and a 7% increase in 4Q2017.
In the latest survey, six of the survey’s Top 10 marketers, including the two leaders, and 13 companies overall reported lower numbers in 3Q2019 than in the year-ago period.
Perennial No.1 BP plc reported 18.30 Bcf/d in 3Q2019, a 13% decrease compared with 21.01 Bcf/d in 3Q2018. CFO Brian Gilvary said recently the London-based supermajor expects global natural gas markets to remain oversupplied to 2021, putting the hurt on U.S. exporters.
No. 2 Macquarie Energy reported 11.19 Bcf/d in 3Q2019*, a 12% decline compared with 12.71 Bcf/d in 3Q2018. No. 3 Tenaska, which had seen a 4% year/year decline in 2Q2019, reported 11.10 Bcf/d in 3Q2019, a 3% increase compared with 3Q2018. Royal Dutch Shell plc’s trading arm also reported an increase at 9.90 Bcf/d in 3Q2019, compared with 9.80 Bcf/d in 3Q2018.
The only other Top 10 marketer to report a year/year increase in 3Q2019 was Chevron Corp. at 3.95 Bcf/d, a 19% increase compared with 3.33 Bcf/d in 3Q2018.
Rounding out the Top 10 were ConocoPhillips (7.54 Bcf/d, a 7% year/year decrease), Sequent Energy Management (6.30 Bcf/d, a 7% decrease), J. Aron & Co. (5.36 Bcf/d, a 5% decrease), Direct Energy (4.98 Bcf/d, a 1% decrease), and EDF Trading NA (4.51 Bcf/d, an 18% decrease).
The overall volume decline is largely the result of lower natural gas prices, which may have curbed the desire of some participants to sell gas, according to NGI’s Patrick Rau, director of strategy and research.
“Those lower prices have also removed some price volatility from the market, which doesn’t exactly help trading volumes either,” Rau said. FERC Form 552 “volumes are clearly rising, so lower reported volumes in our survey suggests the churn rate among trading in the U.S. has been falling. That has been countered in part by increased liquefied natural gas (LNG) exports and the related rise in gas delivered to LNG liquefaction facilities, as well as slightly higher exports to Mexico, but continued falling U.S. natural gas prices seem to be taking a pretty big bite out of reported volumes.”
An analysis of the Federal Energy Regulatory Commission’s Form 552 submissions earlier this year concluded that the amount of natural gas traded in the United States increased in 2018 for the fourth year in a row, reaching a record high, and marketed production also reached new heights. The NGI survey ranks marketers on sales transactions only. FERC’s Form 552 tallies both purchases and sales.
One hope for U.S. natural gas marketers has been the potential for expanding LNG exports, but in the near term at least Gilvary believes gas markets look bearish for domestic LNG.
The Energy Information Administration (EIA) recently said it expects U.S. LNG exports to average 4.7 Bcf/d in 2019 and 6.4 Bcf/d in 2020 as new liquefaction projects come online. Feedgas volumes, or those delivered via pipeline to the terminals, are even higher, peaking at more than 7 Bcf/d in the last week, according to NGI’s U.S. LNG Export Tracker, as some of that gas is used to power operations and the rest shrinks during liquefaction.
Growing export and power generation demand could make both benchmark and spot prices even more sensitive in the years ahead, according to industry analysts.
While more natural gas has slowly displaced coal in the nation’s power stack over the last three decades, a meteoric rise in LNG exports over the last three years has reinforced baseload demand, or the minimum level that must be met on a daily basis across the country, according to RBN Energy LLC.
CME Group plans to launch LNG freight futures contracts along three shipping routes later this month, as the exchange works to bring more price transparency to a rapidly evolving global market. The exchange operator said an increase in U.S. energy exports to Asia and Europe, the International Maritime Organization’s revised rules for marine sector emissions, and an ongoing trade war between the United States and China have sowed additional uncertainty for the global shipping business.
The United States in particular is seen leading the global gas trade in the coming decades. According to the International Energy Agency’s World Energy Outlook 2019, the country is expected to add by 2025 nearly 200 billion cubic meters, or nearly 7.06 Tcf, of global production through shale and tight gas reserves. More than half of the domestic output likely is destined for export as LNG.
The flood of supplies has seen the export market shift, with the traditional point-to-point model that has served the global LNG trade for decades evolving as a more diverse set of suppliers has entered the market and flexible U.S. contracts have driven more spot cargos, creating a tighter shipping market and more volatility.
Two companies joined NGI‘s survey for the first time: Mitsubishi Corp. subsidiary CIMA Energy Ltd. (3.77 Bcf/d) and Houston-based Engie Energy Marketing NA (.80 Bcf/d).
Other highlights of NGI’s 3Q2019 survey were Castleton Commodities reporting 3.24 Bcf/d, a 12% increase compared with 2.90 Bcf/d in 3Q2018; Antero Resources Corp. reporting 3.15 Bcf/d (a 1% increase), ExxonMobil Corp. reporting 3.14 Bcf/d (a 13% increase); ARM Energy Management reporting 2.47 Bcf/d (a 26% increase), Cabot Oil & Gas Corp. reporting 2.40 Bcf/d (an 18% increase); and Encana Corp. reporting 1.66 Bcf/d (a 38% increase).
*The original story indicated an incorrect sales volume for Macquarie Energy in 3Q2019. The volume has been corrected in both the story and the accompanying chart. NGI regrets the error.
© 2024 Natural Gas Intelligence. All rights reserved.
ISSN © 1532-1231 | ISSN © 2577-9877 | ISSN © 1532-1266 |