NGI The Weekly Gas Market Report
Markets | Forward Look | NGI All News Access
Warmer Shift in Weather Leads to Small Gains for Natural Gas Forwards; Florence Impacts Still Unclear
October natural gas prices rose less than a nickel on average from Sept. 6-12 as slightly warmer changes in long-range weather outlooks lifted the prompt month. The four-day stretch of gains eased late in the week as traders began considering the demand destruction likely to occur from Hurricane Florence, and although prices appeared poised to firm again Thursday, they ran out of steam just before the close, according to NGI’s Forward Look.

Most pricing hubs across North America followed the lead of Nymex gas futures, in which October rose 6 cents during the Sept. 6-12 period to reach $2.829, November climbed 3 cents to $2.82 and December edged up 2.5 cents to $2.91. The winter strip (November-March) was up 3 cents to $2.92, as was summer 2019, which hit $2.64.
At the heart of the week’s increases were weather outlooks showing warmer weather in the long range, with small daily shifts in weather models having little impact on overall price movement. The latest weather forecasts were mixed, with European guidance warming quite a bit and adding long-range cooling demand but Global Forecasting System guidance was holding cold across the northern tier, according to Bespoke Weather Services. Both models showed solid demand into the long range, however, as most cold risks would be across the Midwest into the Northeast.
“A few cold risks may enter into the South, which tends to be a bit more bearish for prices until mid-October,” but on net, the forecaster did see gas-weighted degree days (GWDD) tick higher.
“Much of the question is whether any cold will be strong enough to linger into week 3, when we tend to see a truly bullish heating demand increase,” Bespoke chief meteorologist Jacob Meisel said.
Weather models are increasingly mixed, although Bespoke saw some signs limiting expectations of heating demand and keep it from seeing forecasts quite as bullish despite the addition of GWDDs.
Indeed, the market is expected to begin seeing the effects of fall-like temperatures in the coming days and weeks, and Florence could throw a counter punch along the East Coast. Although forecasts remain warmer than normal in the East, the typical seasonal decline in absolute temperatures could begin to curb overall natural gas consumption, according to Mobius Risk Group.
In this regard, astute market participants will be keeping a close eye on southeastern U.S. power burn. “This region will be the battle ground that either provides continued support above $2.75 (Henry Hub) or allows a temporary dip before residential and commercial demand begins to accelerate,” Mobius analysts said.
A look at September power burn in the Southeast showed considerable year/year strength. This primarily has been driven by states which have accessed cheaper Appalachian supply via Atlantic Sunrise (partial in-service), and has been further aided by others exposed to low/stable Henry Hub pricing, the Houston-based firm said.
Florence’s Punch Unclear
The arrival of Florence could provide a temporary boost to already strong southeastern power burn, Mobius said. When hurricane force winds begin to near nuclear-fired power plants, the units go into precautionary shut-down, and natural gas combined cycles are often called on to backstop the loss of nuclear generation.

“Collective demand gains arising from this could be enough to offset the loss in overall power load caused by the destruction of Florence and lower daytime high temperatures,” the firm said.
Ahead of landfall, Duke Energy was powering down the first of two units at its 1,870 MW Brunswick nuclear facility near Wilmington, NC, as heavy rainbands with tropical storm-force winds were spreading on Thursday across the Outer Banks and coastal southeastern North Carolina, according to the National Hurricane Center (NHC).
Duke owns six nuclear generation facilities in the Carolinas that together produce nearly 11,000 MW. While the nuclear facilities are designed to withstand significant winds and rain, the company shuts down plants on a case-by-case basis before sustained inland winds are greater than 73 mph, spokeswoman Mary Katherine Green told NGI.
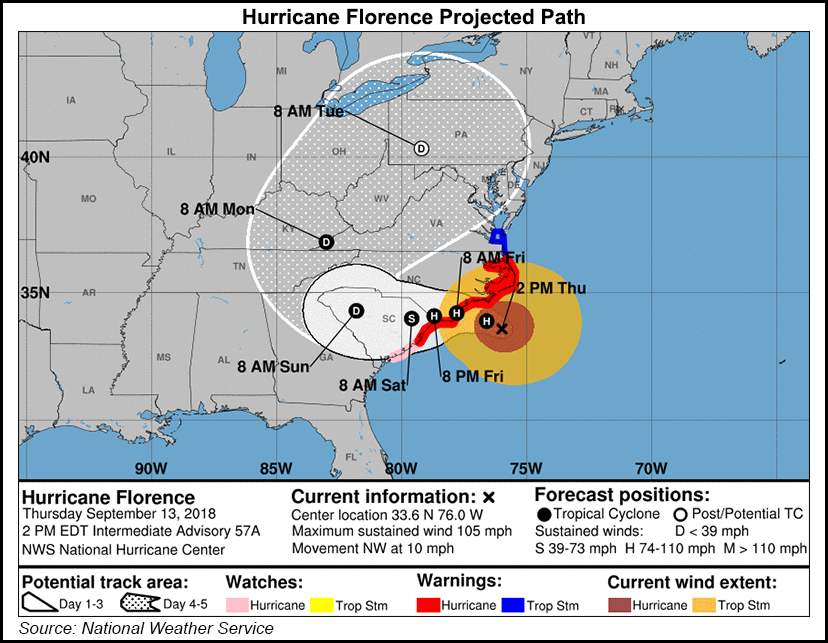
In its 2 p.m. ET update Thursday, the NHC said Florence was about 110 miles east-southeast of Wilmington with maximum sustained winds near 105 mph, maintaining its status as a Category 2 storm. Florence was moving toward the northwest near 10 mph. This general motion, accompanied by a further decrease in forward speed, is expected to continue through Thursday. A turn to the west-northwest and west at an even slower forward speed was expected into Friday, and a slow west-southwestward motion was forecast Friday night and Saturday.
In coastal North Carolina into far northeastern South Carolina, 20-30 inches of rain was expected, with 40 inches in isolated areas. The remainder of South Carolina and North Carolina into southwest Virginia were expected to receive six-to-12 inches, with 15 inches in isolated areas.
The flooding was of greater concern to Duke management, which said Wednesday that while it have lowered the water levels of coal ash ponds at the 14 coal-fired facilities in North Carolina, the bigger challenge was nearby rivers and creeks that could rise and top their cooling ponds, which do not contain ash. The company has protocols in place for inspections, and “staff will perform those inspections as long as it’s safe to do so,” it said. Duke’s emergency response team included 8,000 Carolina-based workers and another nearly 3,000 from the company’s Midwest and Florida units. It also requested an additional 9,400 “off-system” resources, making it the largest deployment of resources in Duke’s territory. The Charlotte, NC-based company expects between one and three million customers to experience power outages following the storm.
Storage Deficit Grows
With Florence’s full impacts not yet known, traders looked to the Energy Information Administration’s (EIA) weekly storage inventory report for price guidance on Thursday. Alas, the reported injection of 69 Bcf was in line with expectations, which had clustered around a build in the upper 60 Bcf range.
“This print is, of course, artificially loose due to the Labor Day holiday, where we saw the loosest weather-adjusted burns of the summer,” said Bespoke, which had called for a 68 Bcf build. “We accordingly expect a tighter print next week,” but said the market is still on track for end-of-season inventories north of 3.35 Tcf. This print confirms recent production growth too, essentially indicating prices are relatively fairly priced.”
Total working gas in underground storage stood at 2,636 Bcf as of Sept. 7, 596 Bcf (18.4%) below the five-year average and 662 Bcf (20.1%) lower than year-ago inventories, according to EIA. The deficit to year inventories grew by 19 Bcf, while the deficit to the five-year average grew by 6 Bcf. Inventories also currently sit below the five-year historical range, EIA noted.
By region, the Midwest posted the largest net build for the week at 32 Bcf, followed by the East, which injected 20 Bcf. The Mountain and Pacific regions injected 4 Bcf each during the period. In the South Central, a 9 Bcf build for nonsalt offset a 1 Bcf withdrawal from salt, according to EIA.
Regarding Thursday’s price action, NatGasWeather said the market continued to assess the latest storage data, tropical systems and record production, “but still with deficits running at multi-year highs near 600 Bcf, which are expected to only slowly improve the next six to eight weeks.”
The Nymex October futures contract settled Thursday at $2.817, down 1.2 cents on the day. November and December each fell 2 cents to $2.80 and $2.89, respectively.
Permian, Midcontinent Forward Curves Shrink
While most pricing hubs posted small gains across their forward curves, tight pipeline conditions in the Permian Basin, and the resulting shuffling of Midcontinent gas in order to capture market demand, sent prices in those regions lower for the Sept. 6-12 period.
El Paso-Permian October forward prices dropped 11 cents to $1.39, November fell 9 cents to $1.37 and the winter strip (November-March) slipped 3 cents to $1.51, according to Forward Look. The summer 2019 strip held steady at $1.40, while the winter 2019-2020 strip rose 2 cents to $2.02.
Similar price action was seen at Waha, where October fell 11 cents to $1.38, November dropped a dime to 1.358 and the winter 2018-2019 (November-March) slipped just 2 cents to $1.52. The summer 2019 package edged up a penny to $1.40, and the winter 2019-2020 tacked on 3 cents to hit $2.03.

The losses at the front end of the forward curve come amid growing pipeline constraints out of the Permian. Meanwhile, with gas demand expected to wane in the coming weeks thanks to fading summer heat, additional price weakness could be seen.
The robust production growth in the Permian has led to shuffling of gas in other nearby basins, and the Midcontinent in particular has carried much of the burden, with prices there steeply discounted to the benchmark Henry Hub. At NGPL Midcontinent, October lost 3 cents from Sept. 6-12 to reach $2.12, more than 70 cents below Henry, Forward Look data show.
The winter 2018-2019 strip, which held steady at $2.34, sat Wednesday at a 58-cent discount to the benchmark. Summer 2019 prices at $1.99 were about 65 cents below the summer strip at Henry. For comparison, summer-to-date prices at NGPL Midcontinent have averaged 56 cents below the benchmark.
At OGT, October shed a nickel from Sept. 6-12 to reach $1.47, $1.36 below Henry. November sat at a $1.35 discount, while the winter 2018-2019 strip sat at a $1.32 discount. An improved takeaway picture begins to emerge in the 2019-2020 winter strip as prices Wednesday were just 63 cents below Henry. Spot prices so far this summer at OGT have averaged $1.11 below the benchmark.
Given the capacity constraints coming out of the Permian, producers overwhelmingly have indicated plans to slow down drilling in the basin, analysts said last week at the annual Barclays Energy and Power CEO Conference in New York City. But it’s not a long-term issue. Halliburton Co., which announced a reduction in its 3Q2018 outlook, said several producers may have “blown through” 2018 Permian budgets, but they planned to get “straight back to work” in January.
In the meantime, some producers have turned their attention to other producing basins like the Eagle Ford Shale, where the the rig count has increased by an average of three rigs per month in 2018, according to DrillingInfo. Year-to-date, the rig count is up 22 rigs, while the shale play also added 19 rigs in 2017. As of Thursday, the rig count sat at 135, which is lower than the high of 337 rigs in September 2014, but up from the low of 52 rigs in May 2016.
© 2024 Natural Gas Intelligence. All rights reserved.
ISSN © 2577-9915 | ISSN © 2577-9877 | ISSN © 1532-1266 |